Farm Designer
Drag-and-drop plant placement ![]() Open this page in the app
Open this page in the app
The farm designer allows you to graphically design the layout of your garden, monitor your FarmBot’s position, and visualize data such as photos, plant spread, and points.
Map menu
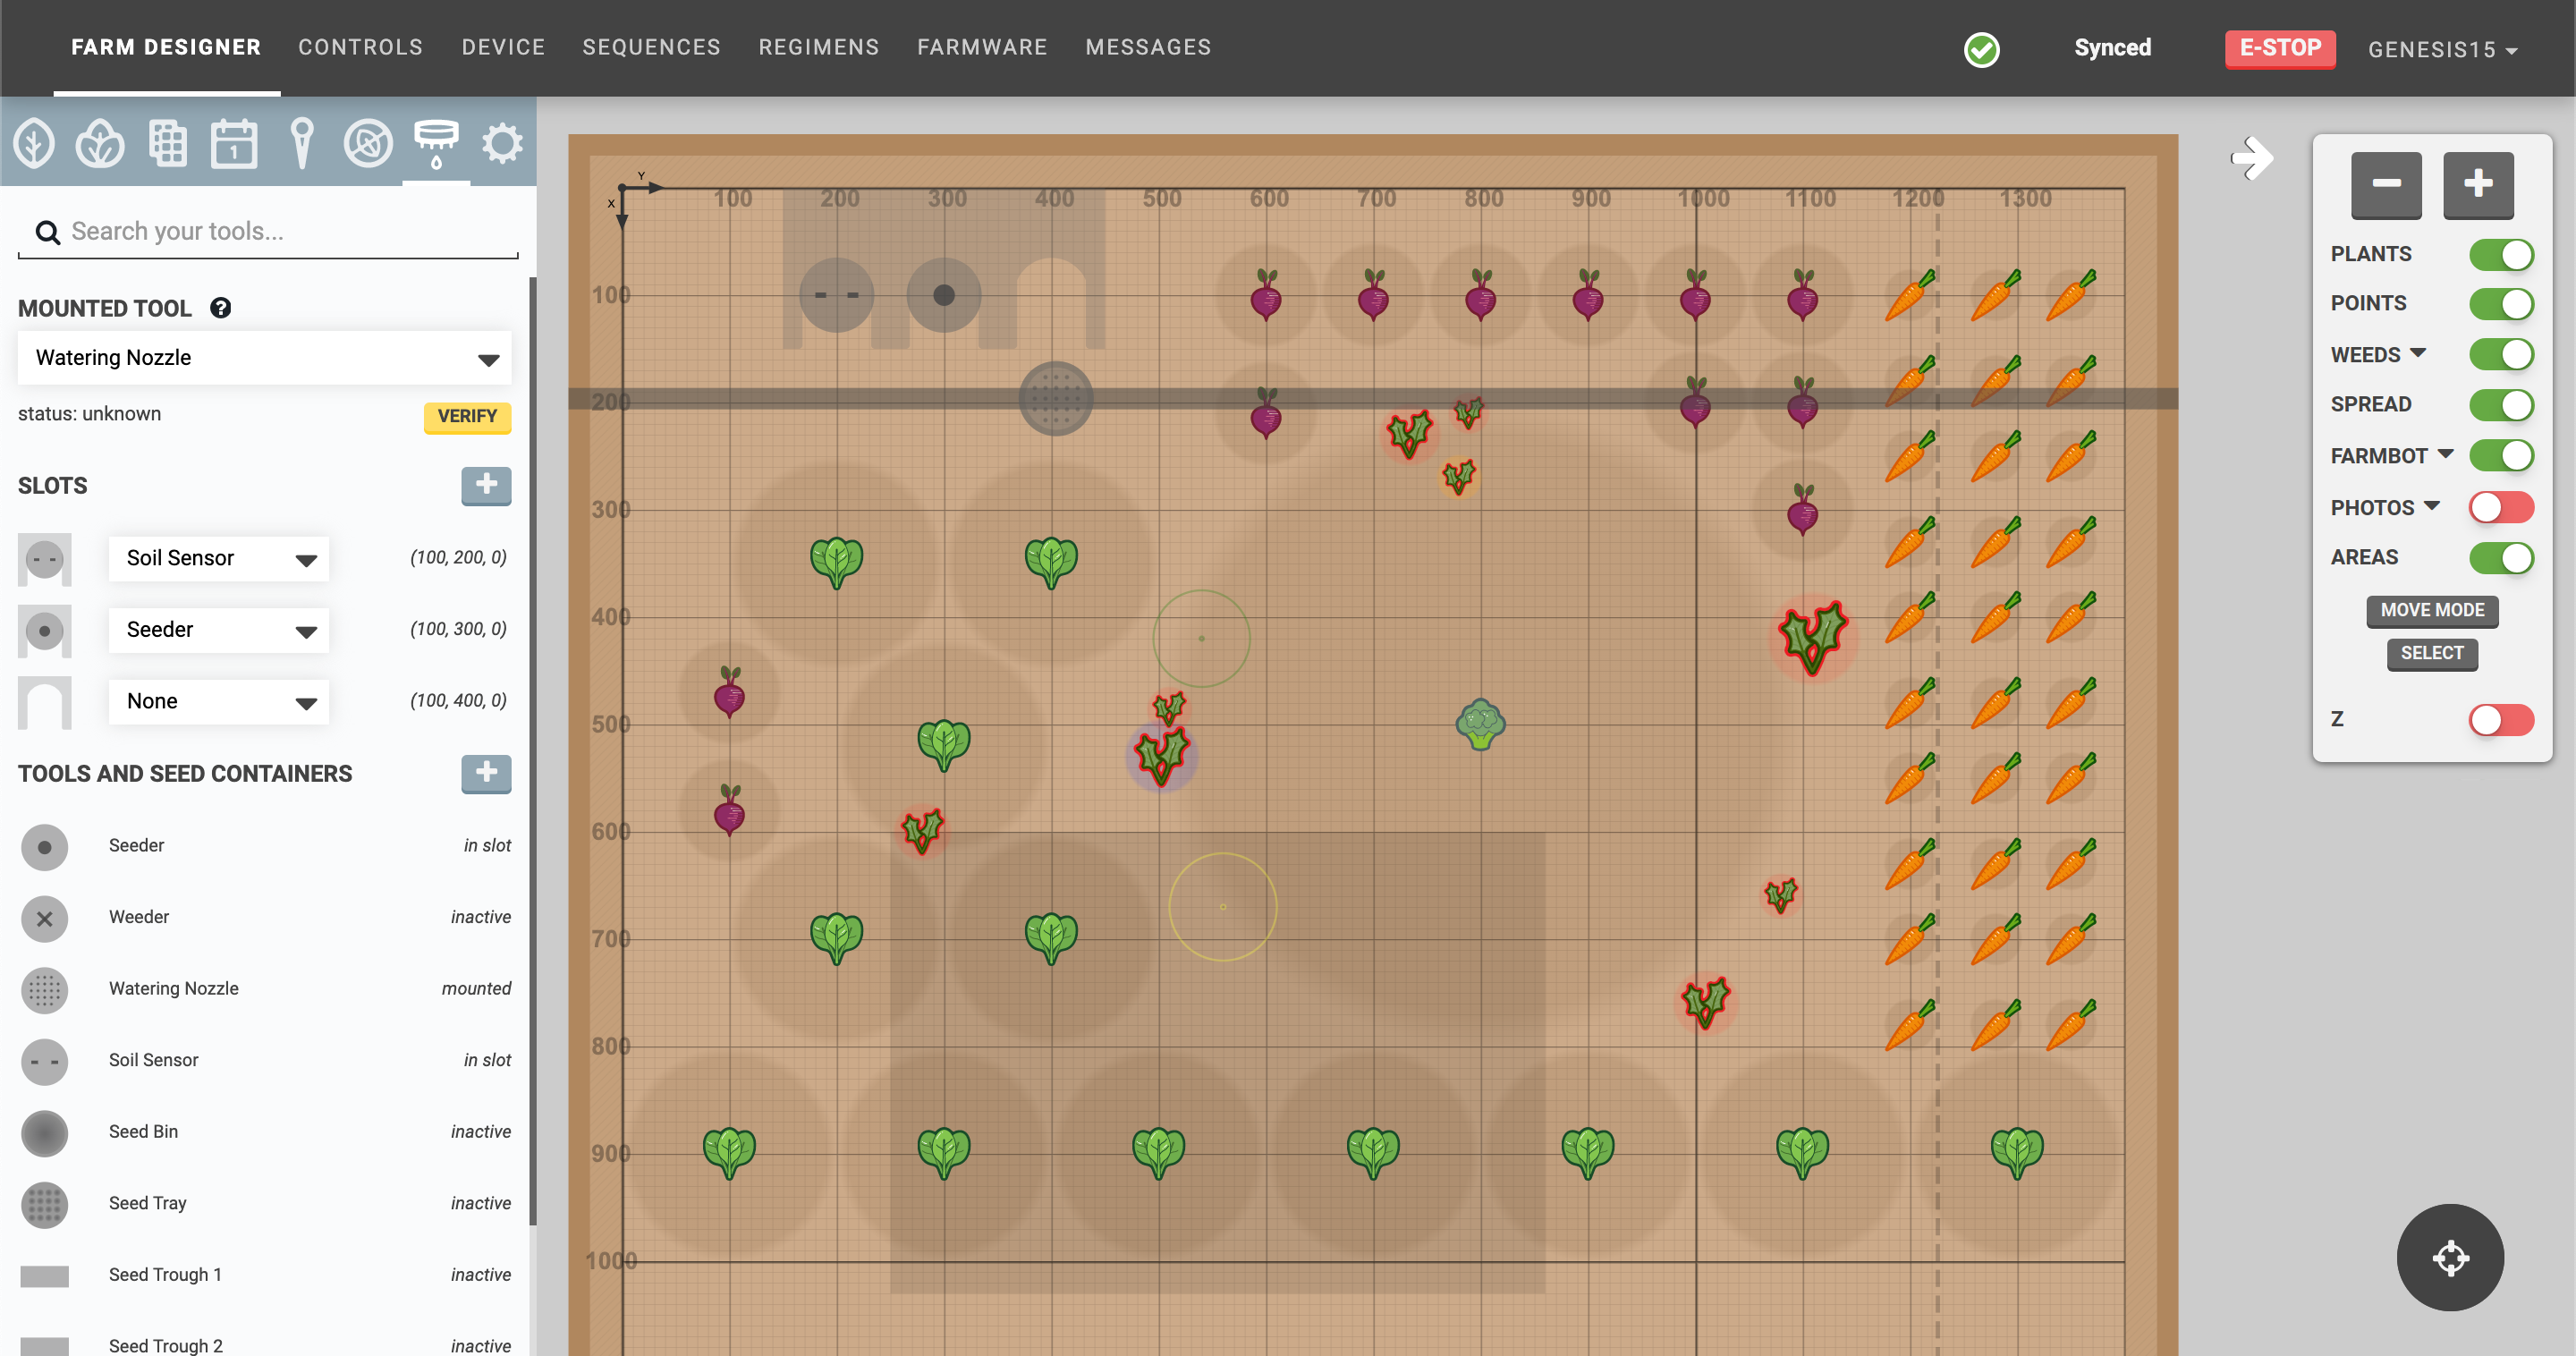
Click the white button in the top right of the map to open up the map menu. Here you will find and buttons to zoom in and out of the map, as well as a toggles to turn on and off map layers:
| Layer | Description |
|---|---|
| PLANTS | The plant icons (not including weeds or spread) |
| POINTS | Points created in the points panel |
| WEEDS | Weed icons and their spread |
| SPREAD | The spread of plants and weeds |
| FARMBOT | The FarmBot gantry, UTM or tool head, slots, tools, seed containers, peripheral state visualizations, and axis limit lines |
| PHOTOS | Photos taken by FarmBot’s onboard camera. See camera calibration if photos are not positioned, scaled, or rotated correctly. |
| AREAS | Areas defined by group filters. |
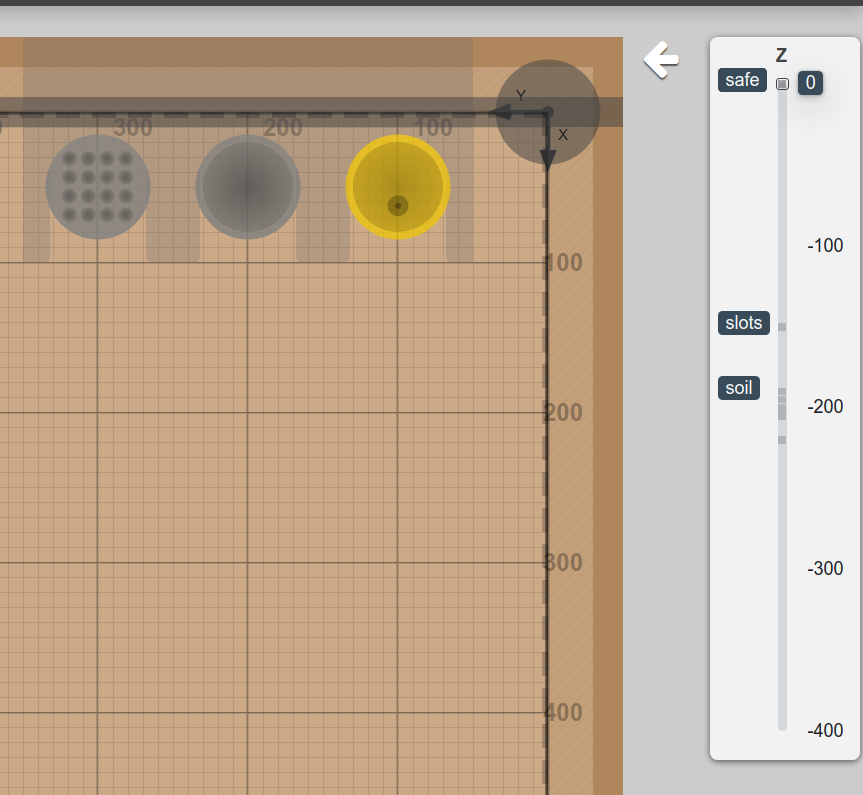
| Z | Graphical display of FarmBot’s current z-axis position and relevant garden levels. |
Move mode
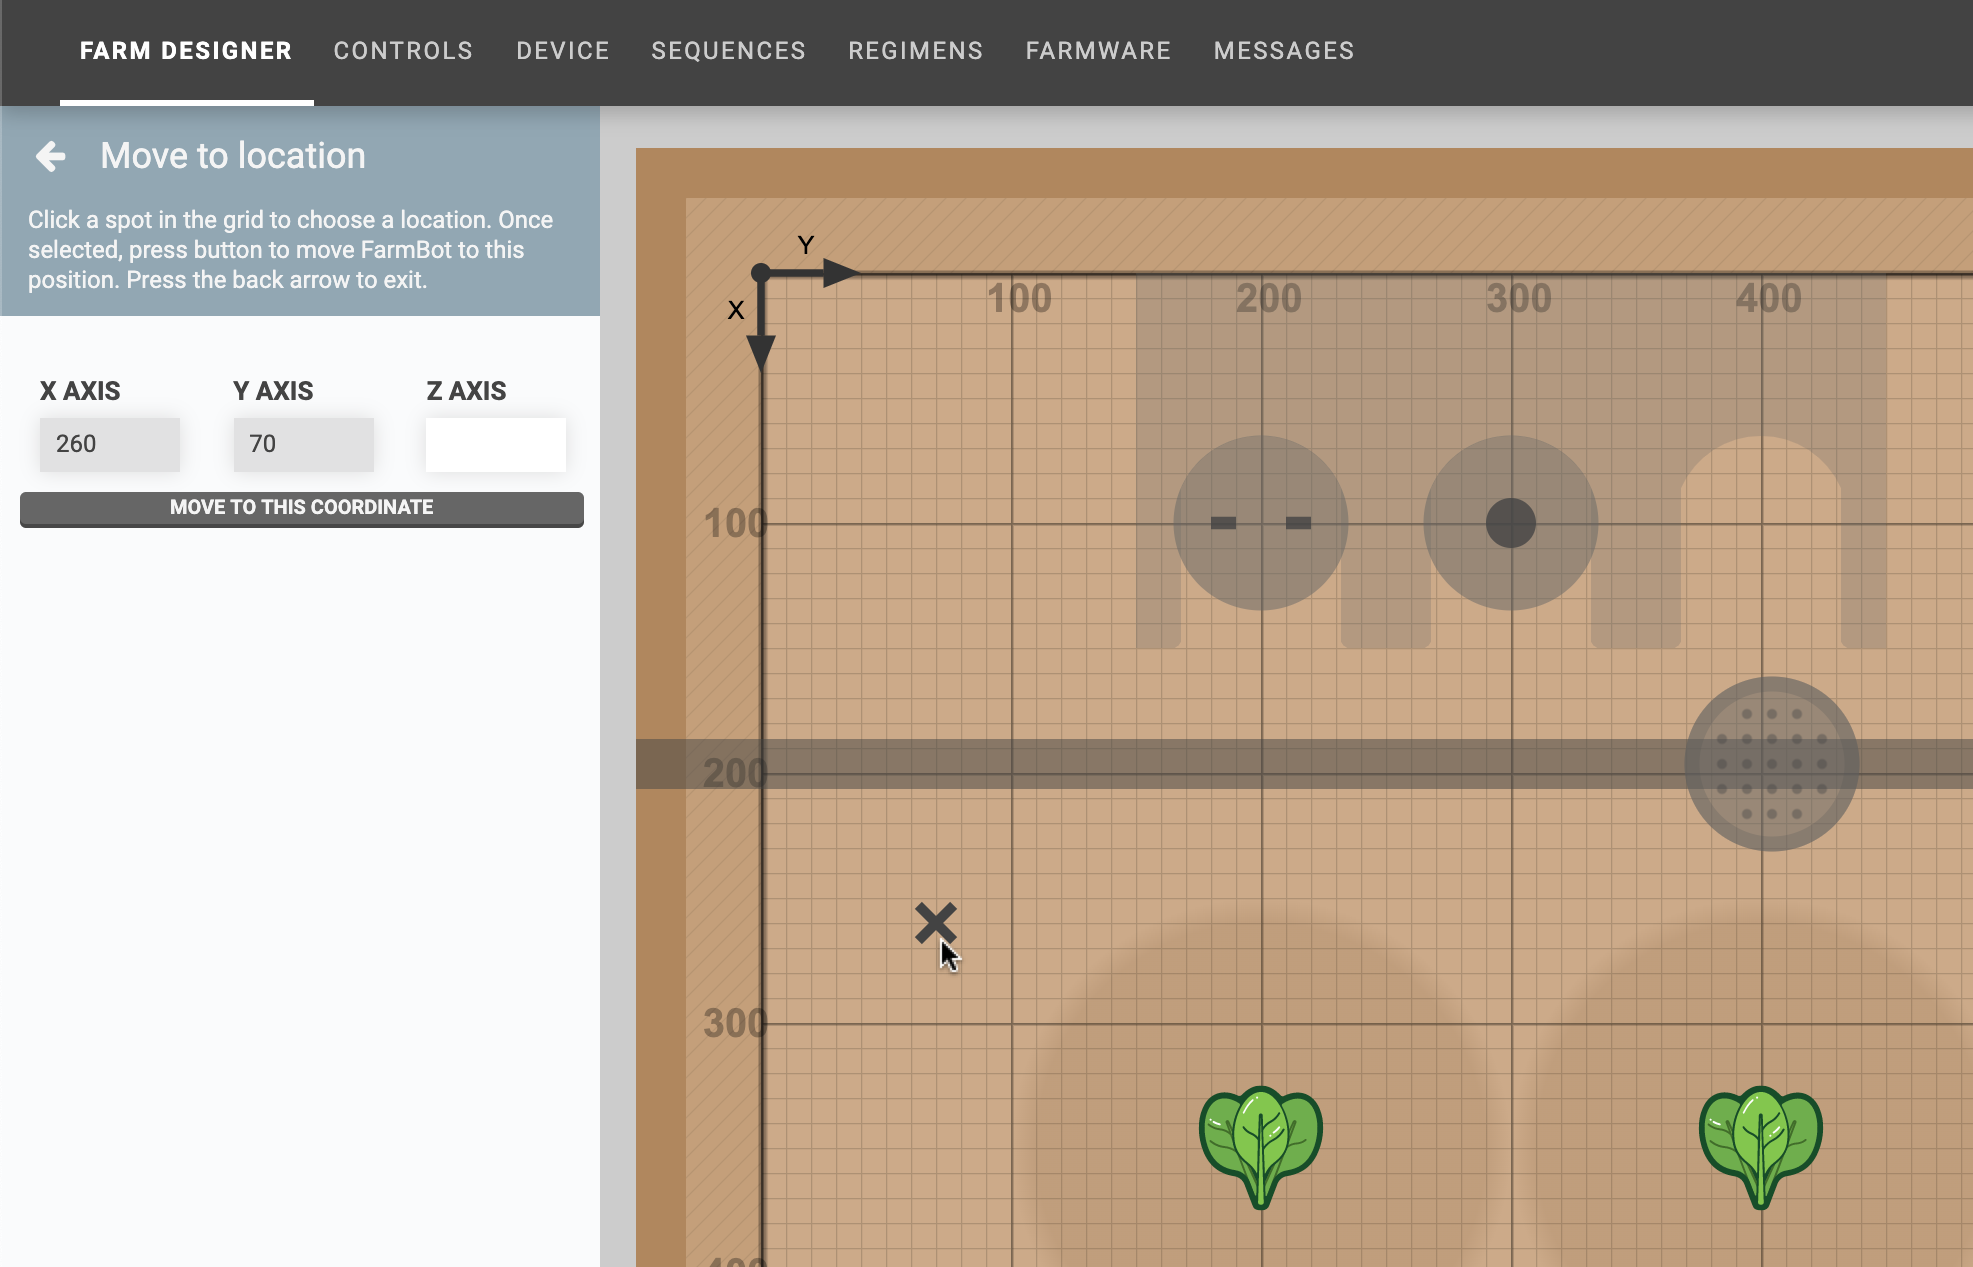
Pressing the button in the map menu will open the move to location panel. Click any spot within the map grid to mark it with an . Then press to send FarmBot to the selected position. You can optionally enter a new coordinate for the Z-AXIS.
Select mode
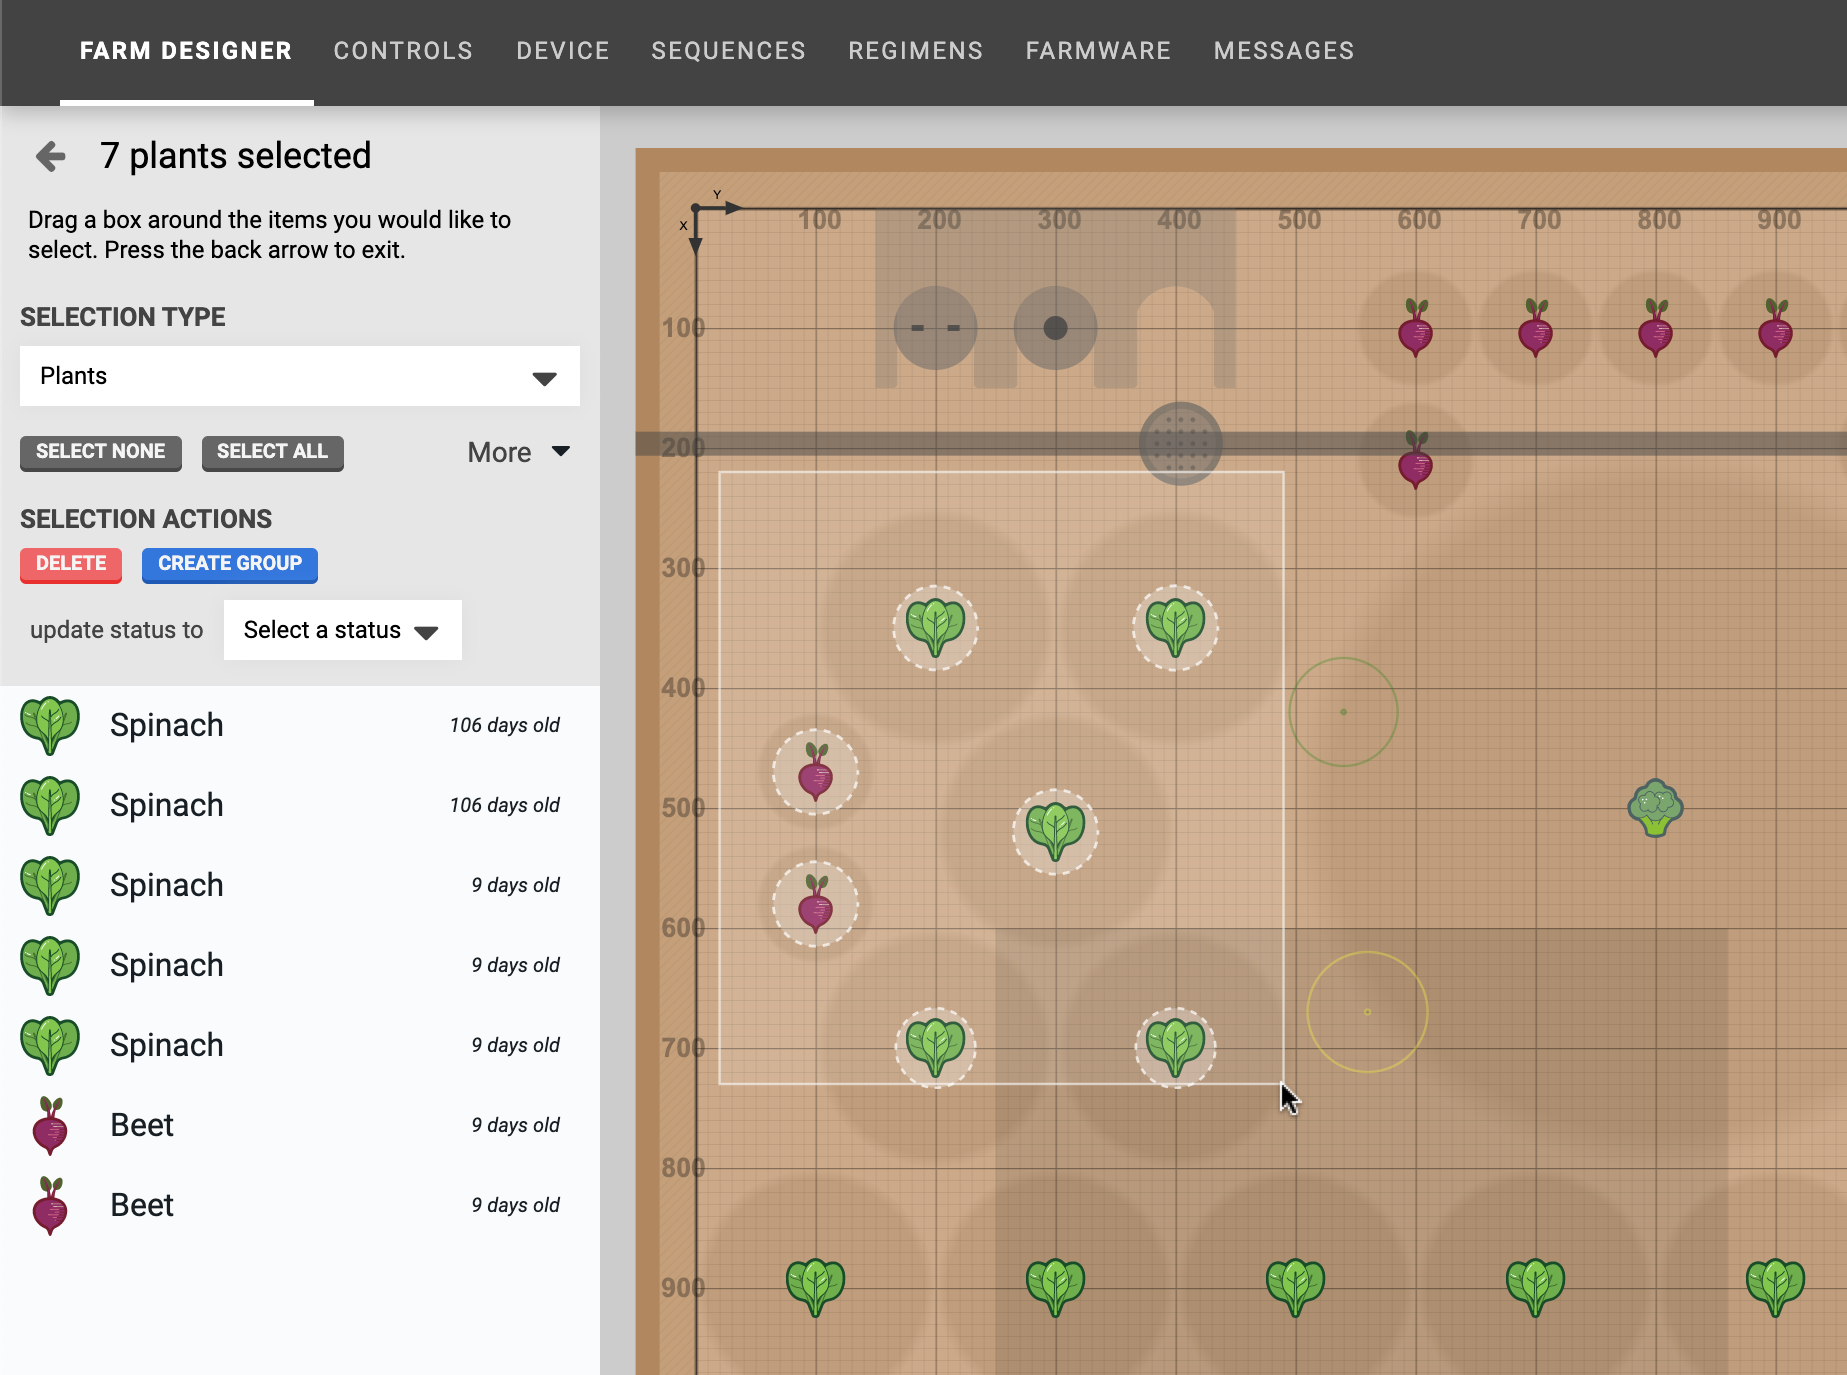
To select multiple plants, click anywhere in the map and drag the mouse cursor to create a box selection. All plants located within the box will be displayed in the select panel. Alternatively, you may press the button located in the map menu, and then use the box-selection technique.
Once the select panel is open, you can click-to-add additional plants to the selection, or click an already selected plant to remove it from the selection. Once you are satisfied with your selection, use one of the SELECTION ACTIONS.
You may also change the SELECTION TYPE to allow for selecting other objects in the map, such as weeds or points.
Profile viewer
Press the icon at the bottom of the screen to open the profile viewer.
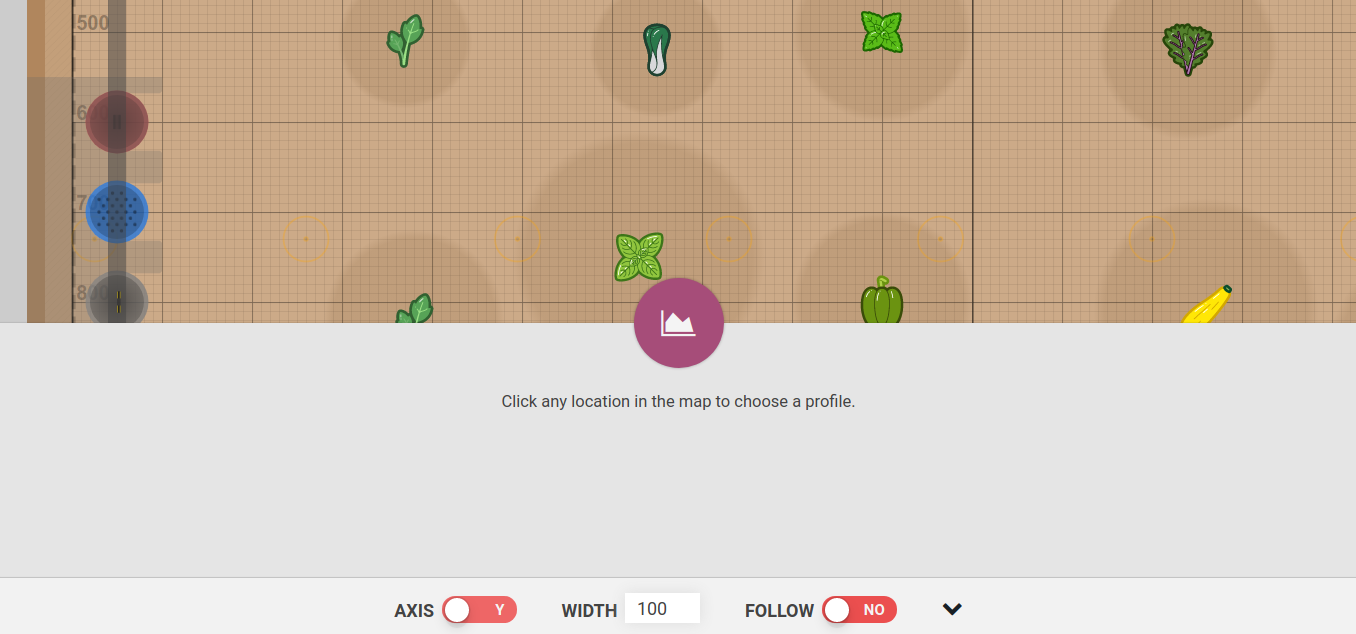
Click anywhere in the farm designer map to view a profile of that location. A shaded area will appear across the map to indicate the region the profile represents: any items within the region will appear in the profile.
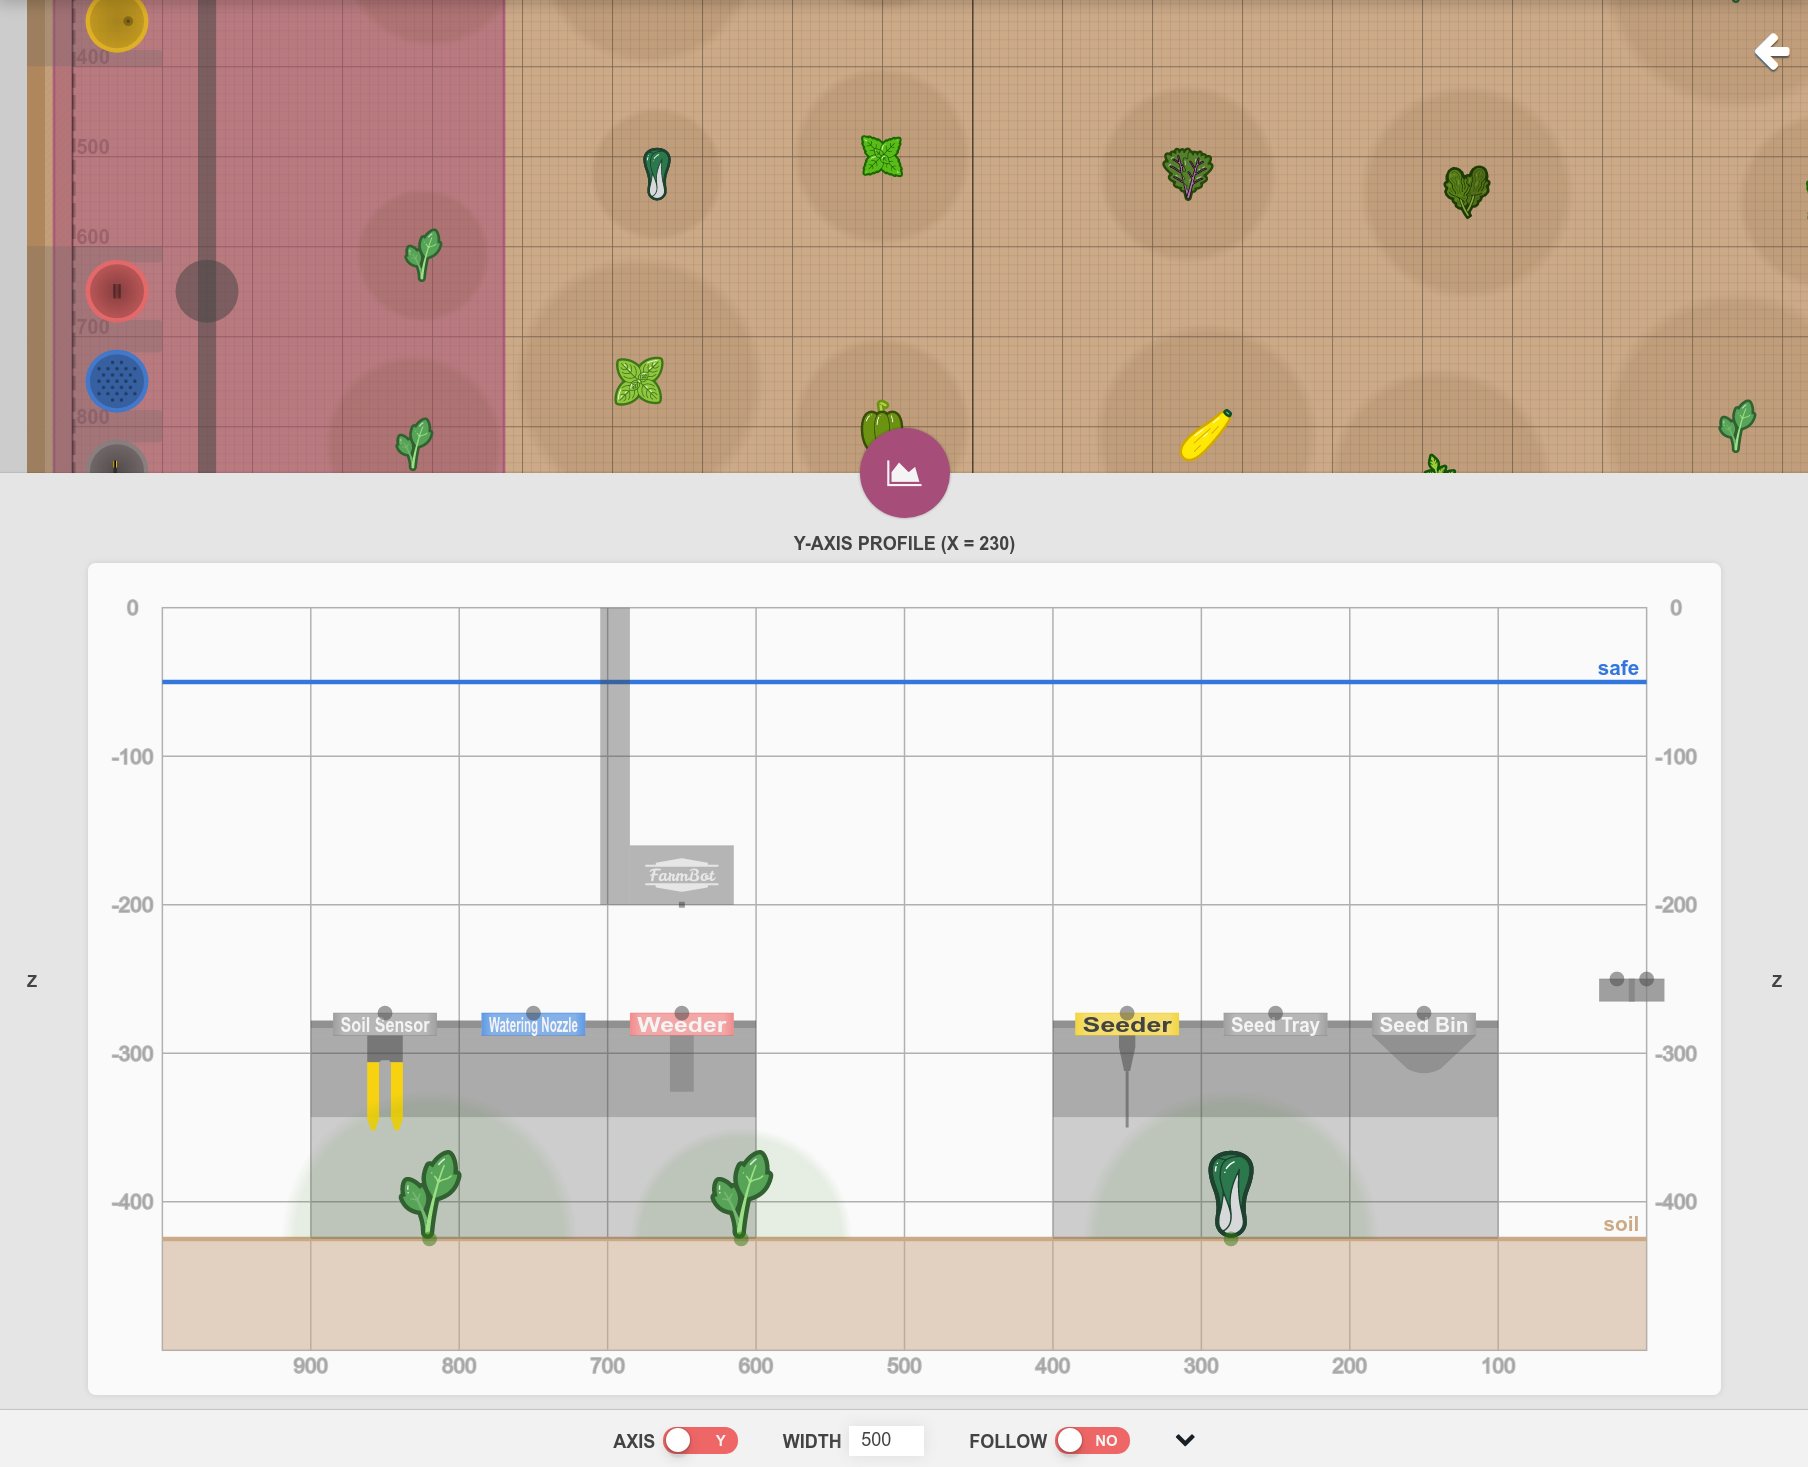
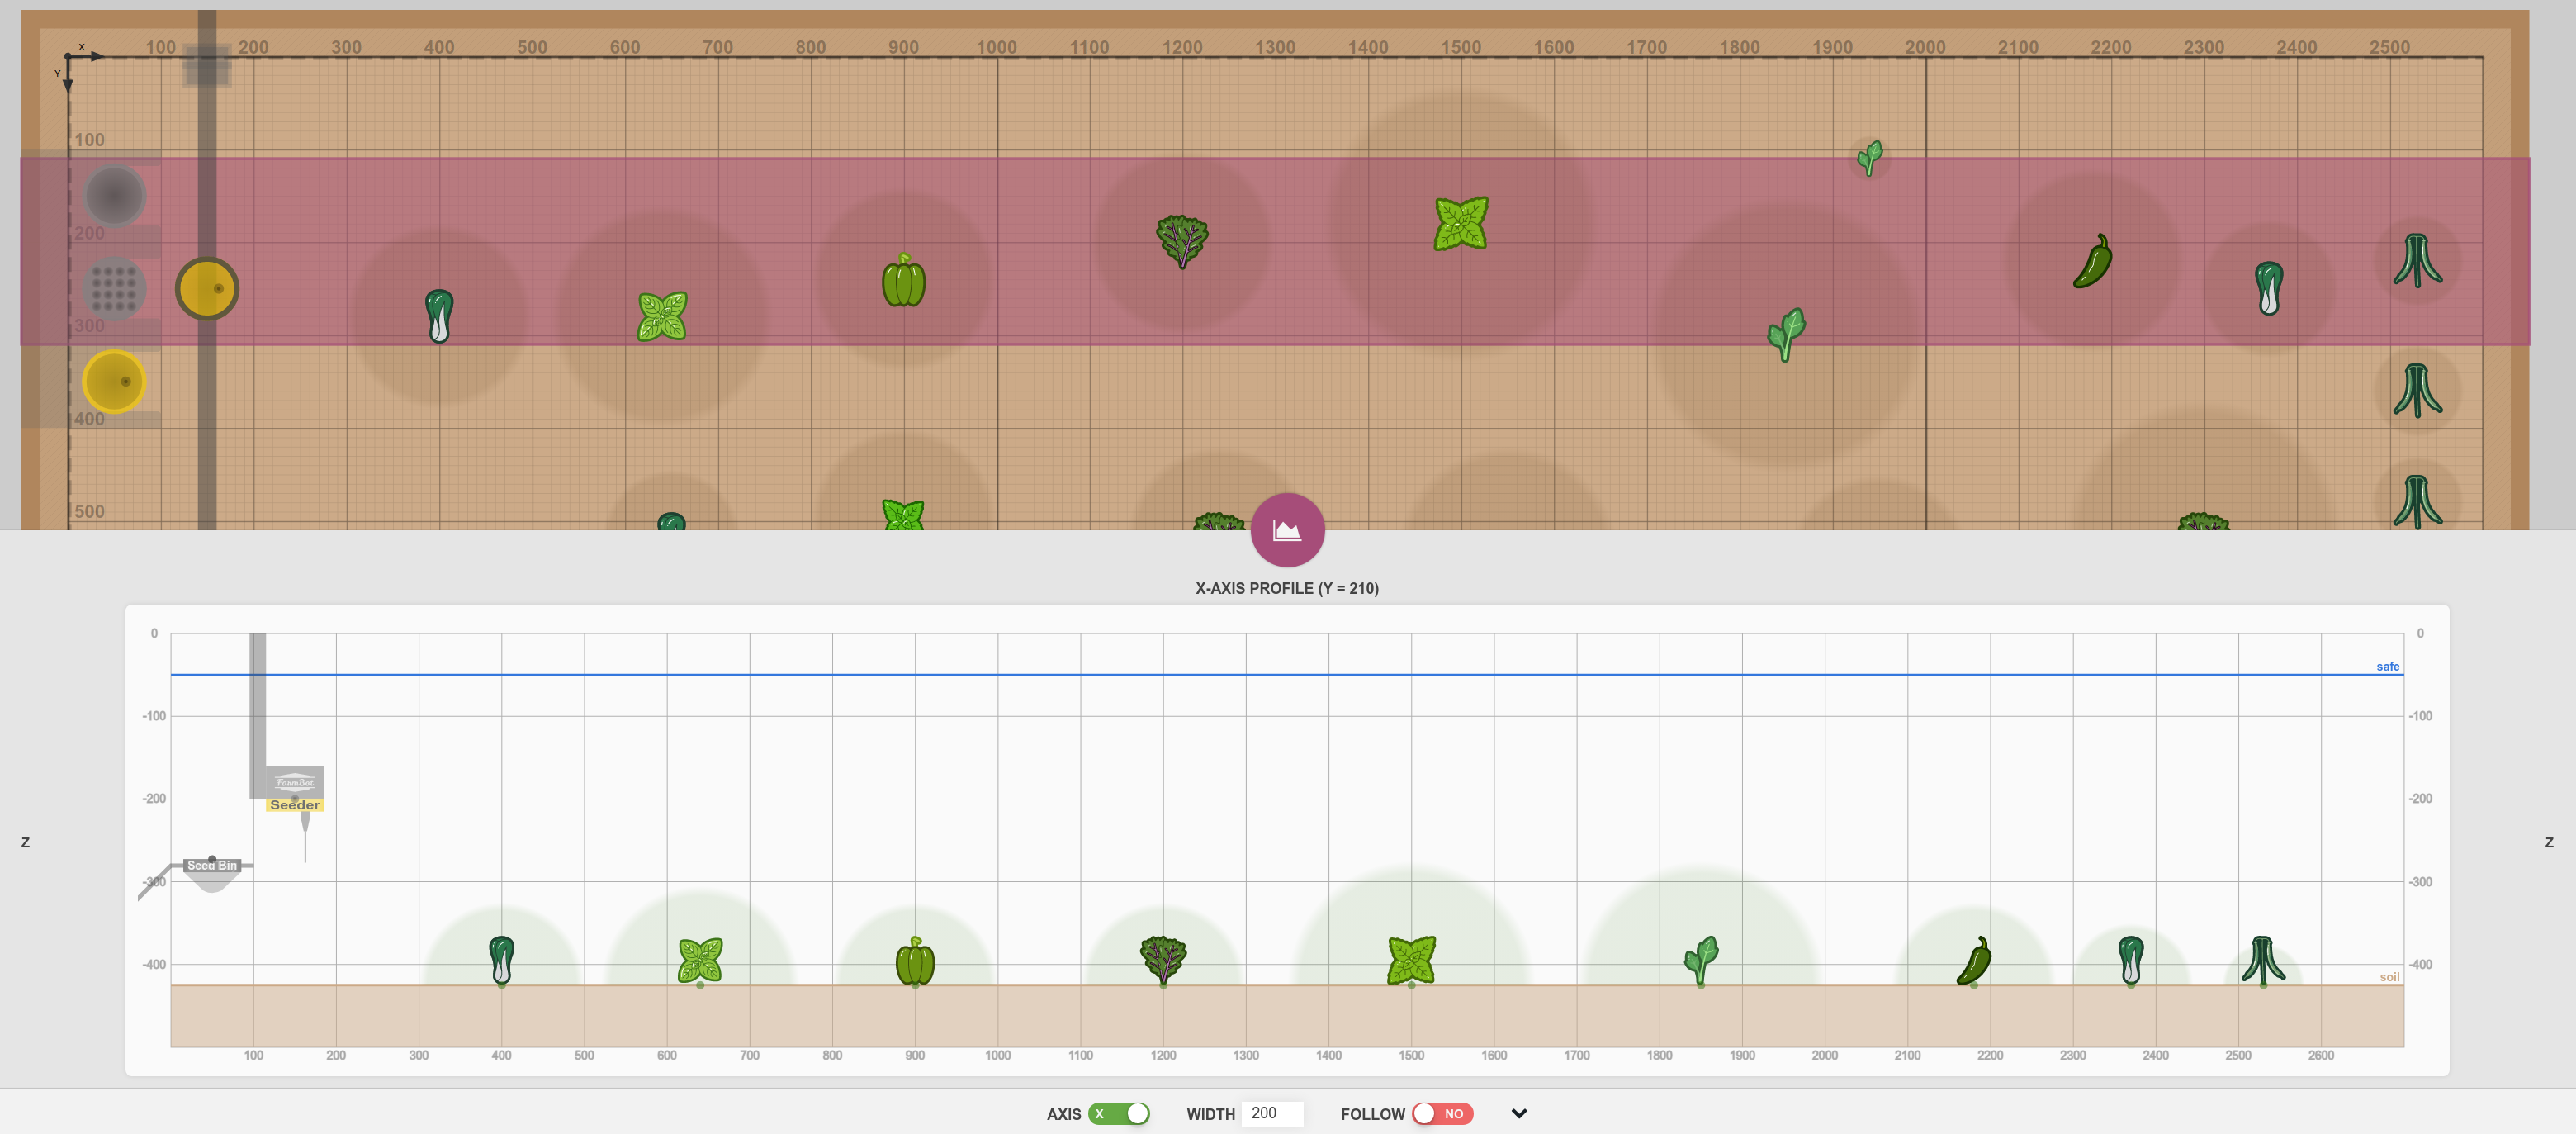
The selected SAFE HEIGHT (from axis settings) is shown as a horizontal blue line, and the selected SOIL HEIGHT is shown as a horizontal brown line. Points and soil height points are shown as dots with lines connecting them according to their color.
Use the AXIS toggle to switch between X and Y axis profiles. Input a different WIDTH to narrow or broaden the profile search area. Enable FOLLOW to use FarmBot’s current location as the profile position. Click the icon to switch between quick and full profile views.
What’s next?
- Plants
Add and manage the plants in your garden
- Groups
Organize your plants, weeds, points, and more
- Gardens
Replant the same garden season after season


- Events
Schedule FarmBot actions


- Points
Create custom locations in your garden

- Weeds
Manage the weeds found in your garden
- Controls
Manually control your FarmBot from anywhere!

- Sensors
Manually read FarmBot’s sensors 🌡️
- Photos
Take and view photos of your plants

- Tools
Manage tools and seed containers

- Settings
Manage app and FarmBot settings