Connectivity
See FarmBot’s current connection status and 24 hours of historical health metrics ![]()
The connectivity popup in the main nav bar of the app has three tabs chock full of information about your FarmBot. When FarmBot and the web app are fully connected, you will see a green next to CONNECTIVITY.
If there are connectivity issues, you will see a red and may need to troubleshoot your connection.
Keep in mind that there may be a problem with your phone or laptop’s connection and no issues with the FarmBot.
Realtime tab
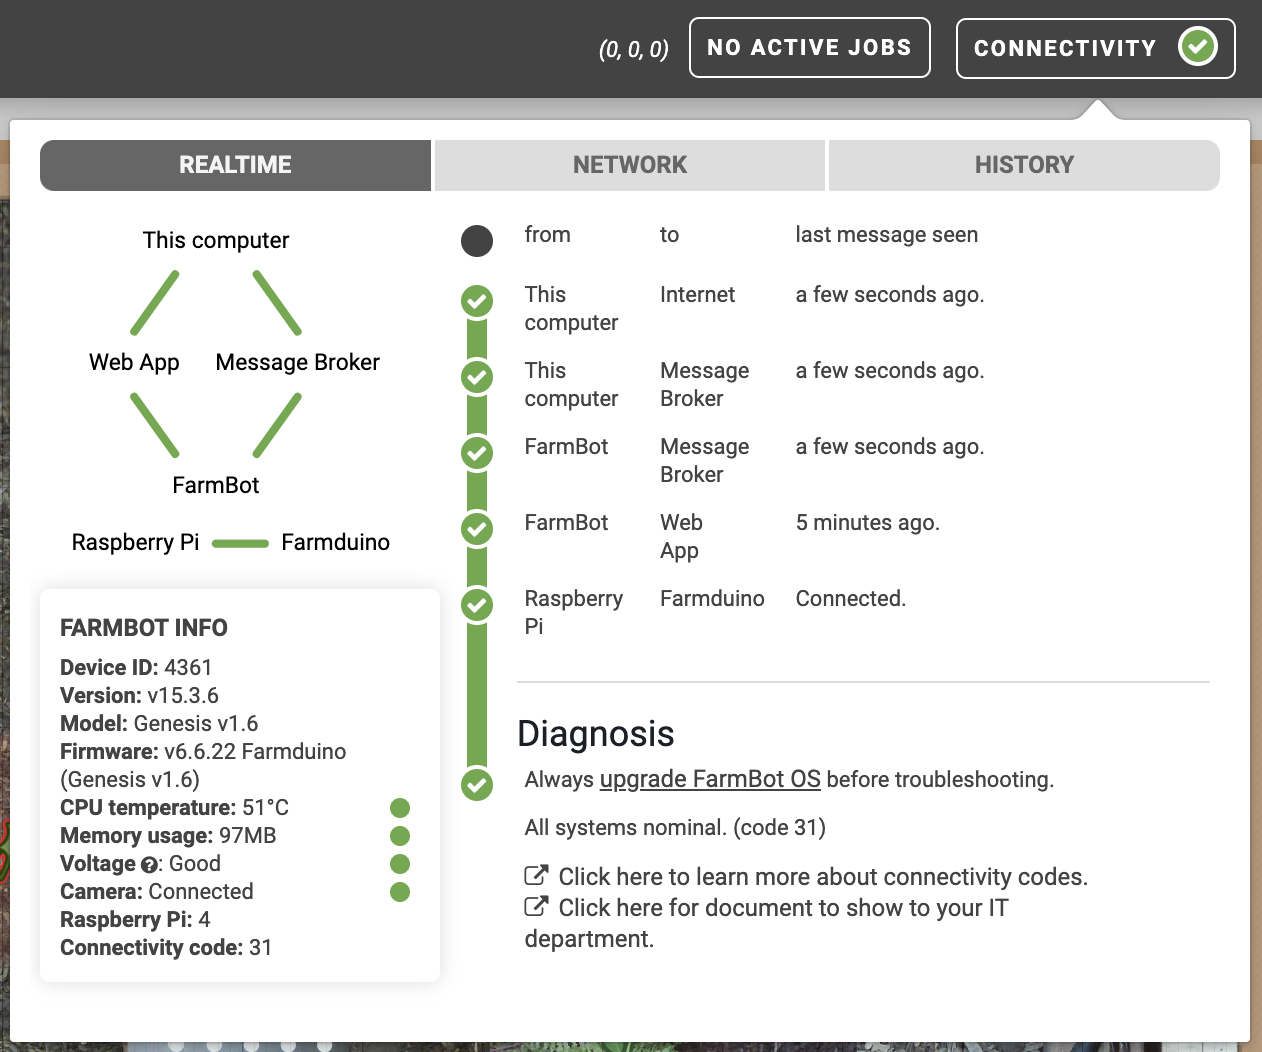
The realtime tab shows information about your computer’s and FarmBot’s current connection to the web app and message broker, as well as some vital health metrics such as the CPU temperature and voltage of the Raspberry Pi.
If everything is operating properly, you should see all green checkmarks and other green indicators. Additionally, the diagnosis should say All systems nominal. (code 31).

If you see some yellow or red indicators and are experiencing issues with your FarmBot, you may need to improve the WiFi connection to your bot, talk to your network administrator to ensure FarmBot is allowed to use your school or work network, or perform other troubleshooting.
Network tab
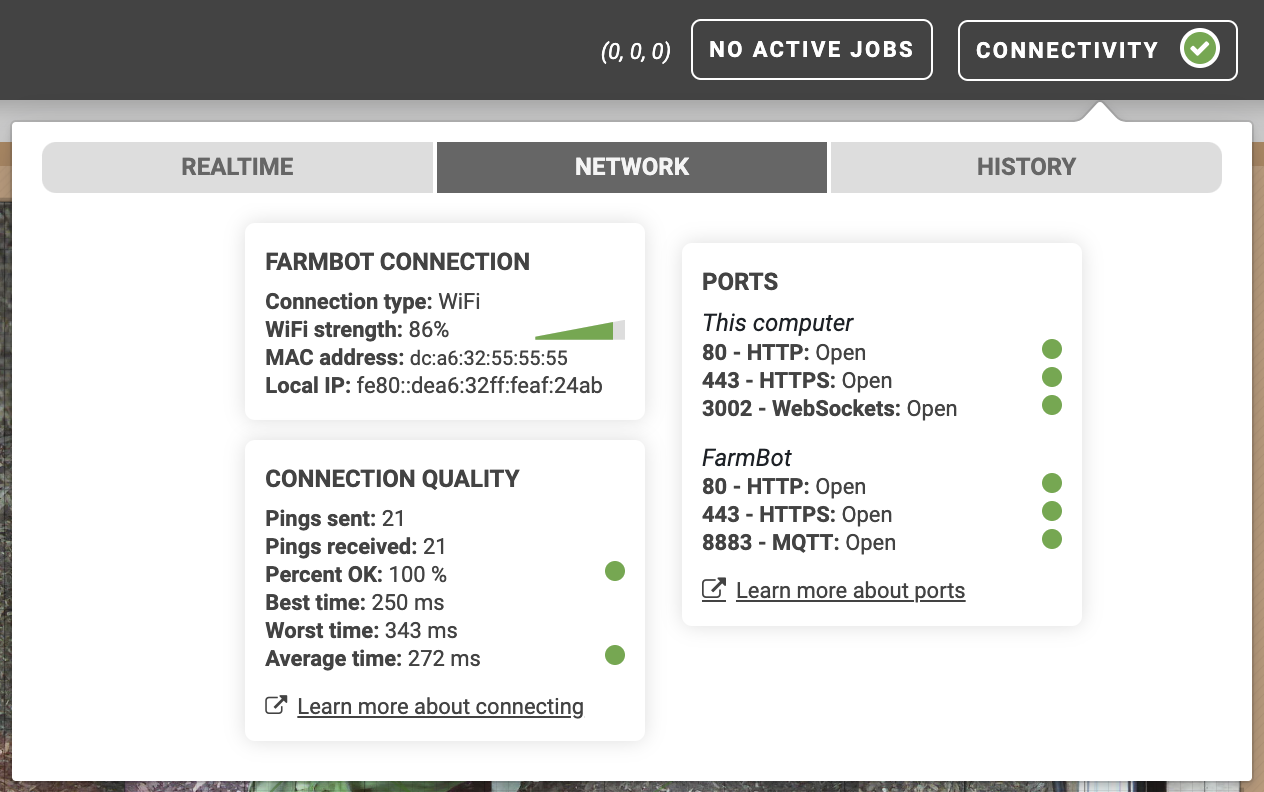
The network tab shows additional information about your FarmBot’s network connection such as its WiFi signal strength and local IP address, as well as indicators as to whether or not the necessary network ports are open to both the FarmBot and your computer.
The connection quality section can help determine if your internet connection needs to be improved, for example, if your FarmBot is located too far away from the WiFi router or if you are using a poor quality cellular or satellite connection.

If you have installed your FarmBot at a school or business with an enterprise network, consult with your IT department if you are seeing that one or more ports are closed. This is the number one most likely reason for connectivity issues amongst new FarmBot installations. This document will help your IT department configure the network correctly.
History tab
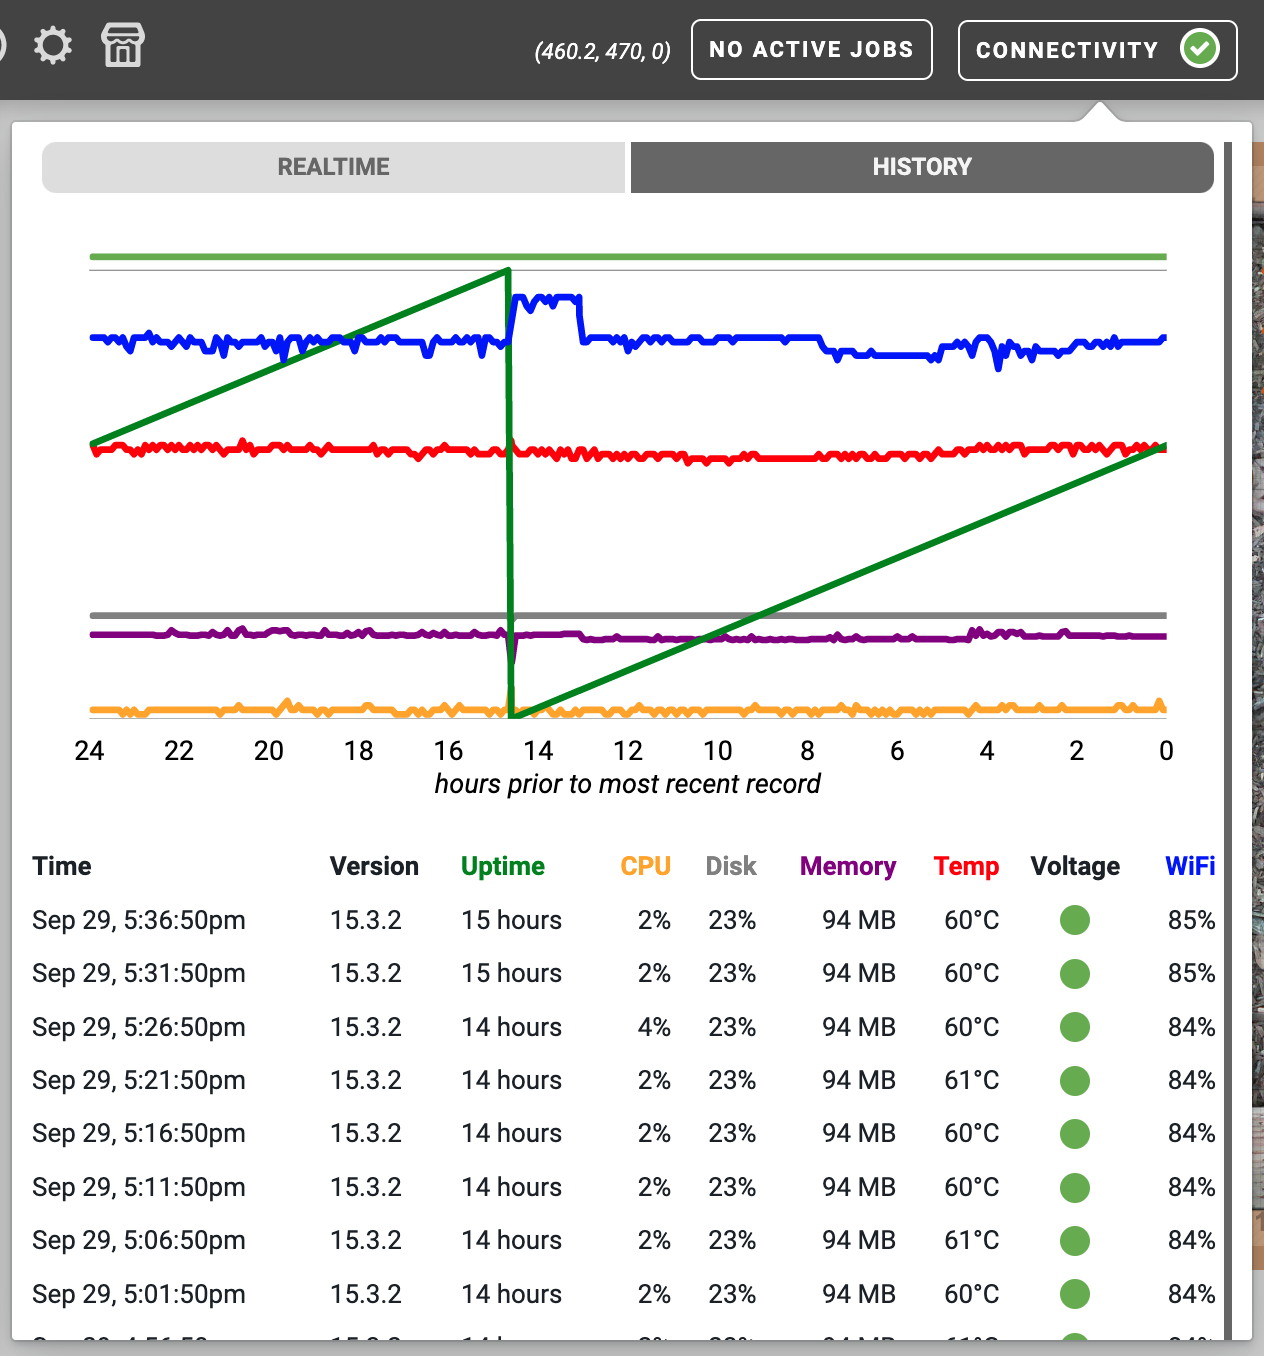
The history tab shows 24 hours of historical health metric data. Data points are collected every 5 minutes and include the time, FarmBot OS version, uptime (how long it has been since FarmBot booted), CPU use, disk use, memory use, temperature of the Raspberry Pi’s CPU, system voltage, and WiFi signal strength.
This data is most useful for troubleshooting issues that may occur sporadically or after a change to your hardware or software. If everything is operating properly, you do not need to check the history tab regularly.
The image below shows a healthy FarmBot that rebooted about 14 hours ago.
